Log-normal distributions in human behavioral data
The log-normal distribution appears all the time in human activity.
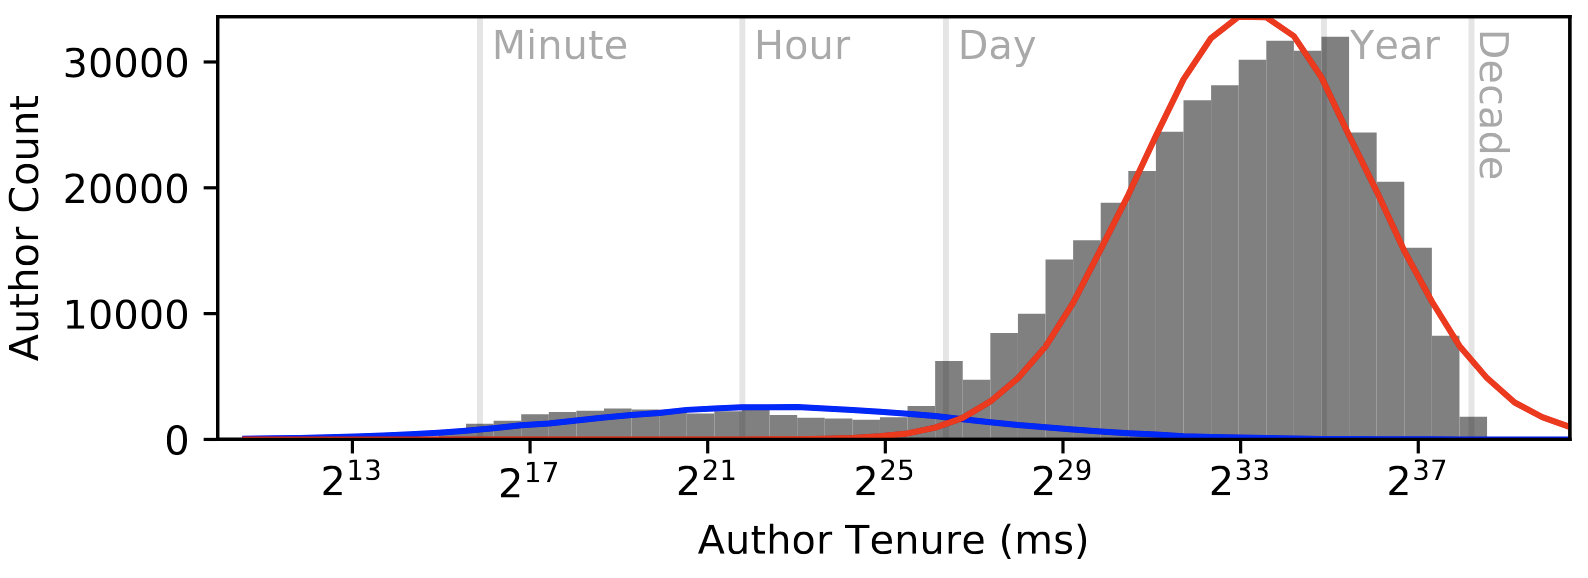
 Total amount of time between first and last post on the CaringBridge blogging platform. We see two log-normal phenomena represented: first, within a session, posts are published according to a rough log-normal. Second, total stay on the platform follows a rough log-normal. From one of my papers.
- Wim J. van der Linden. 2006. “A Lognormal Model for Response Times on Test Items”. Time between responses on tests is log-normal.
- Aaron Halfaker, Os Keyes, Daniel Kluver, Jacob Thebault-Spieker, Tien Nguyen, Kenneth Shores, Anuradha Uduwage, Morten Warncke-Wang. 2014. “User Session Identification Based on Strong Regularities in Inter-activity Time”. Time between user activities online is log-normal (within a “session”, but time between sessions is also log-normal!).
- Zachary Levonian, Marco Dow, Drew Erikson, Sourojit Ghosh, Hannah Miller Hillberg, Saumik Narayanan, Loren Terveen, Svetlana Yarosh. 2021. “Patterns of Patient and Caregiver Mutual Support Connections in an Online Health Community”. Time between first and last post on a blogging platform is log-normal.
- Wikipedia tells me that length of comments posted in Internet discussion forums, reading time on online articles, and length of chess games are all approximately log-normal as well.
Why? I have no-idea. I suspect this is related to and often confused with the ubiquitousness of power laws in many other human activities.
Please send me more pointers on this topic if you have any.